Mapping crops accurately has always been a challenging task in remote sensing. Traditionally, analysts had to combine multiple steps: time-series modelling of vegetation indices, fusing optical and radar data, integrating climate information, and finally validating with costly field surveys. Even then, results often contained noise, required post-processing, and were limited in scale.
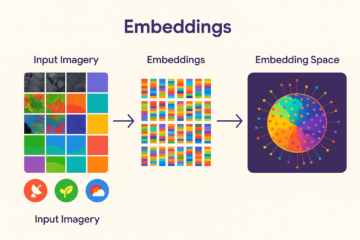
Google’s Satellite Embeddings dataset, produced by the AlphaEarth Foundation Model, offers a new path. Instead of working with raw imagery and pre-processing pipelines, users can now access 64-dimensional embeddings at 10 m resolution that already capture:
- Temporal context – a full year of observations.
- Spatial context – information about the surrounding landscape (≈1.28 km).
- Multi-sensor fusion – Sentinel-1, Sentinel-2, Landsat-8, radar, optical, and climate data.

How the Workflow Changes
- Apply a Crop Mask
Use an existing land cover dataset to exclude non-agricultural pixels (e.g., CDL in the US or ESA WorldCover globally). This ensures only cropland remains in the analysis. - Cluster Embeddings
The 64-dimensional vectors are grouped into clusters. Each cluster represents a distinct crop type or cropping pattern. Unlike traditional approaches, the embeddings produce very clean cluster boundaries because they incorporate spatial context. - Label with Aggregate Statistics
Instead of field-level labels, official crop statistics are enough. For example, if county-level data show that corn occupies the largest area, the cluster with the largest area is labelled “corn”. The next-largest cluster might be “soybean”. This drastically reduces the need for costly ground surveys. - Use NDVI to Interpret Clusters
The NDVI (Normalised Difference Vegetation Index) can help in interpreting clusters. By clicking on a pixel within a cluster, users can generate its NDVI time series.- A single peak in the NDVI curve suggests a single-cropped field.Two peaks indicate double-cropping.Persistent high NDVI values indicate dense vegetation such as forests.
- Generate Crop Maps
The final map assigns each cluster to a crop type, with clear separation between major crops. My tests showed embeddings could accurately map corn and soybean without detailed field data.
Why This Matters
- Minimal pre-processing: No need for harmonic modelling, cloud masking, or sensor fusion.
- Lower data requirements: Only aggregate crop statistics are needed to label clusters.
- Cleaner outputs: Cluster boundaries are smoother and less noisy compared to traditional pixel-based methods.
- Scalability: Crop type mapping becomes feasible across larger regions with limited resources.
- NDVI integration: NDVI plots make it easier to interpret cropping patterns within clusters.
Beyond Crop Mapping
The same workflow is not limited to agriculture. Because embeddings integrate spectral, temporal, and spatial context, the method can be extended to:
- Land use mapping: Differentiating between urban, forest, wetland, and other land cover categories.
- Habitat mapping: Identifying ecosystems and monitoring their changes over time.
- Species mapping: Supporting biodiversity studies by linking habitat patterns to species distribution.
These broader applications demonstrate how embeddings can serve as a versatile tool for environmental monitoring and management.
Conclusion

Satellite embeddings transform crop type mapping from a complex, resource-intensive workflow into a streamlined process. By encoding spectral, temporal, spatial, and climatic context into compact vectors, embeddings enable accurate crop maps using only minimal ancillary data. Adding NDVI analysis on top of clustering gives practitioners an intuitive way to interpret crop phenology and distinguish between cropping systems.
And importantly, the same embedding-driven workflow can support land use, habitat, and species mapping—opening new opportunities for scalable monitoring of agriculture, ecosystems, and biodiversity.

0 Comments